How to do delay measurements at MEG
Instruction on how to do a delay measurement of Audio or Picture stimulus experiment at the MEG.
The measurement
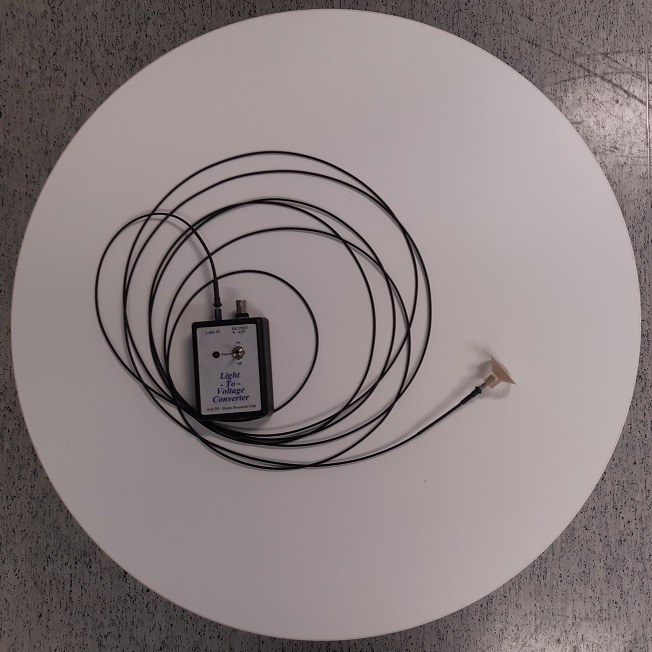
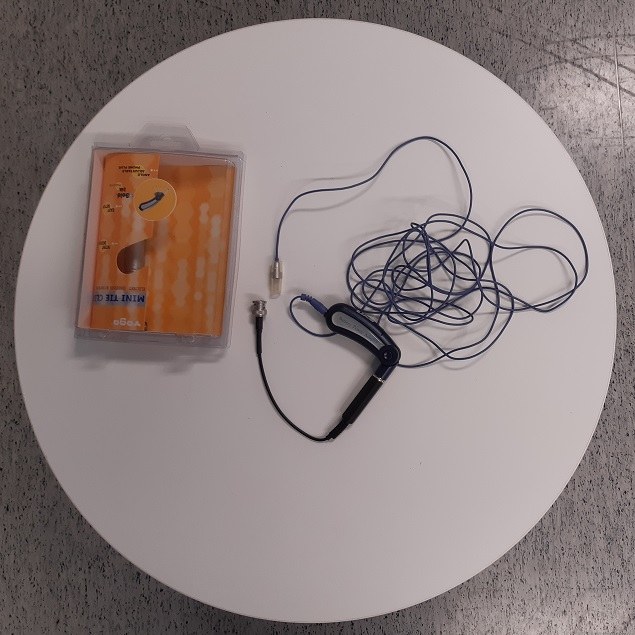
- Connect either audio or light measurement device (see figs) to the Misc/Analog BNC-input of the data acquisition system. Open that particular channel in the data acquisition (for example Misc007).
- Connect the audio (microphone) or light sensor to the source of your stimulus.
- Start your stimulus scenario. The light sensor picks up the signal best when the contrast between “stimulus on” and “stimulus off” is large. Microphone might need you to pump up the volume a bit.
- Record some raw data where the audio or light signal is measured as an analog “bump” and the trigger comes from your stimulus computer.
- Transfer and analyze your data. Idea is to define the time between the start of the stimulus trigger and start of the actual stimulus, which is the delay time. The delay time should not have too much jitter, although it will have constant delay, which can be taken into account in the data analysis.
Analysis of delay measurement
- In CIBR server, start terminal window (or for example in Putty after XMing is on) and run command “mne_browse_raw”
- Open your delay-measurement file .fif
- Go to Adjust -> Filter
- Untick “Filter active” if it is on and press “Apply” or directly “OK”. Filters can distort delay signals which are supposed to have fairly sharp rise times.
- Go to Adjust -> Selection
- Press Add.. and a new window opens
- Select (probably these but will depend how you measured your delays) channels Misc007 and STI101. You can name the selection in “Name” if you want and press “Add”
- Press “Done” and goes back to “Selection” window
- Find your new selection you made (for example named “New selection”) and press “Done”.
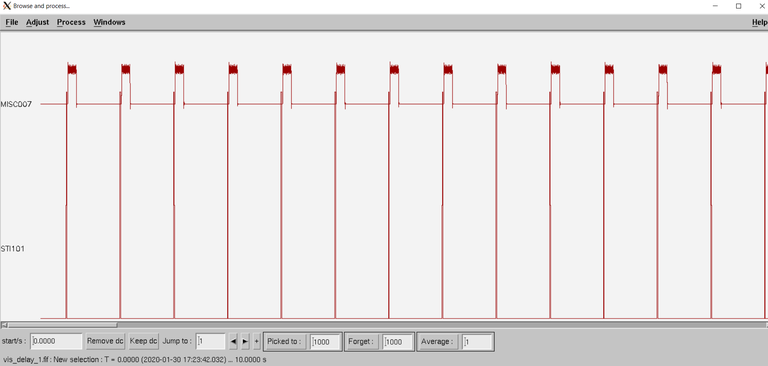
- In Adjust -> Scales you can adjust the time scale (Time Span) and if needed also the intensity scale. Zoom your time scale so that you can confidently see the rise moment of your analog signal and preferably also the digital signal from STI101simultaneously. For example set the time span to 0.2s
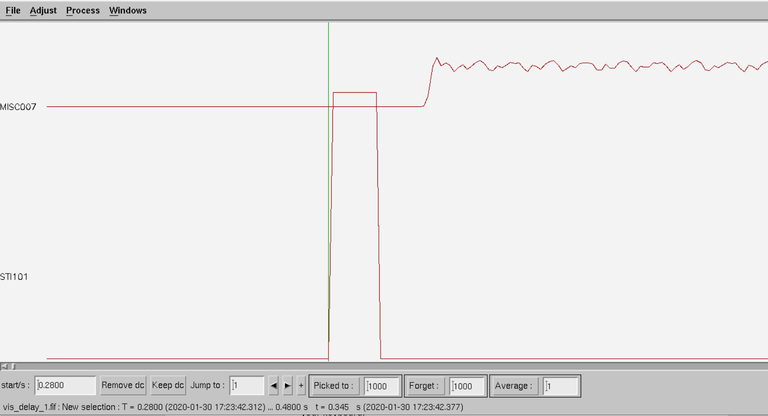
- Using your mouse, select the point where the digital signal starts to rise. A green line appears. You can adjust the position of the line also using left and right arrows of your keyboard.
- Mark down the time after “t” (notice small t) for example in a spreadsheet. It is up to you do you want to mark down the full time in parentheses or just the time right after “t”. Just be consistent.
- Next, find the rise point of the analog signal and mark that in your spreadsheet.
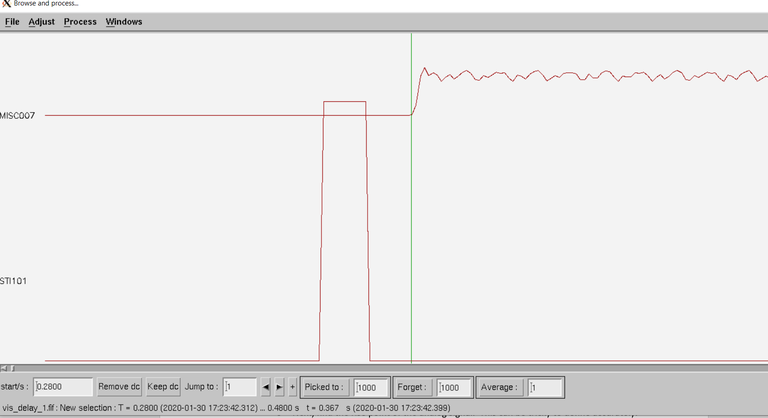
- Measure and calculate the difference for several (preferably at least for few tens) trigger-analog signal pairs.
- In this example, the time difference between the signals (for one event only) was 22ms. This should approximately be the delay of visual signals and the jitter is only 1 or 2ms. The jitter mostly seems to depend on the accuracy and consistency how you defined the rise point of the analog signal.
- When doing the delay measurement, you should run through your whole experiment and have delay measurements at least from beginning, middle and end of your paradigm. For example, in theory it is possible, that there could be some memory issues with longer paradigms in the stimulus computer. You can (and should if there are no real brains in the MEG simultaneously) reduce the saved .fif-file size by pausing the recording in the data acquisition computer.
- Defining the start time of analog signal accurately can be somewhat tricky. It helps, if the contrast is large – in visual stimuli, for example use in delay measurement black vs white; when using audio stimuli increase the volume, although spoken or otherwise “natural” stimuli might still be difficult. Be consistent in how you mark the start point.
