Variables of interest
Current dipoles and primary responses
The brain signals that the MEG records have been modeled and theorized as point-like dipolar magnetic fields. The idea is to look at brain activation at a given point in time and try to fit one or a few dipoles on either a spherical conductor or then individual MRIs. The dipolar field is then calculated and with a RMS fitting we can estimate the dipole(s) that explains the recorded magnetic field best.
Dipoles do not fully explain or reflect the rich and vibrant circuitry that is going on in the brain, but it gives us an idea of the spatial location of MEG recorded activation and the activation sequences that take place during for example an evoked response in the brain.
There are many newer and more sophisticated source localization methods that have been invented and implemented after the use of dipolar source localization. They are different in the way they arrive at a solution and many of them are much more automated in their approach, but dipole fitting is still a valid analysis method to date.
Dipolar fitting is most used for localizing and modeling primary neural responses. Primary neural responses, also known as evoked responses, are the phase and time locked responses instantly following a stimulus. The best-known primary responses are in the range of 0-1000 ms after a stimulus. Different stimulations have specific temporal and spatial primary responses. For example, short auditory stimulations give rise to a myriad of responses in different parts of the brain. A well-known response is the N100 response that arises ~100 ms after an unpredicted stimulus. This is true for all sensory input but is perhaps most studied in the auditory processing. The N100 is seen on the sensor level (MEG) as a peak in the recording. The peaks of different channels give rise to the topography of the signal. By fitting dipoles on a conductor surface, we can calculate the forward solution that would arise from that dipolar field. The field is then compared to the actual recording by the RMS method. With this we can locate the dipolar components that best explain the recorded magnetic field.
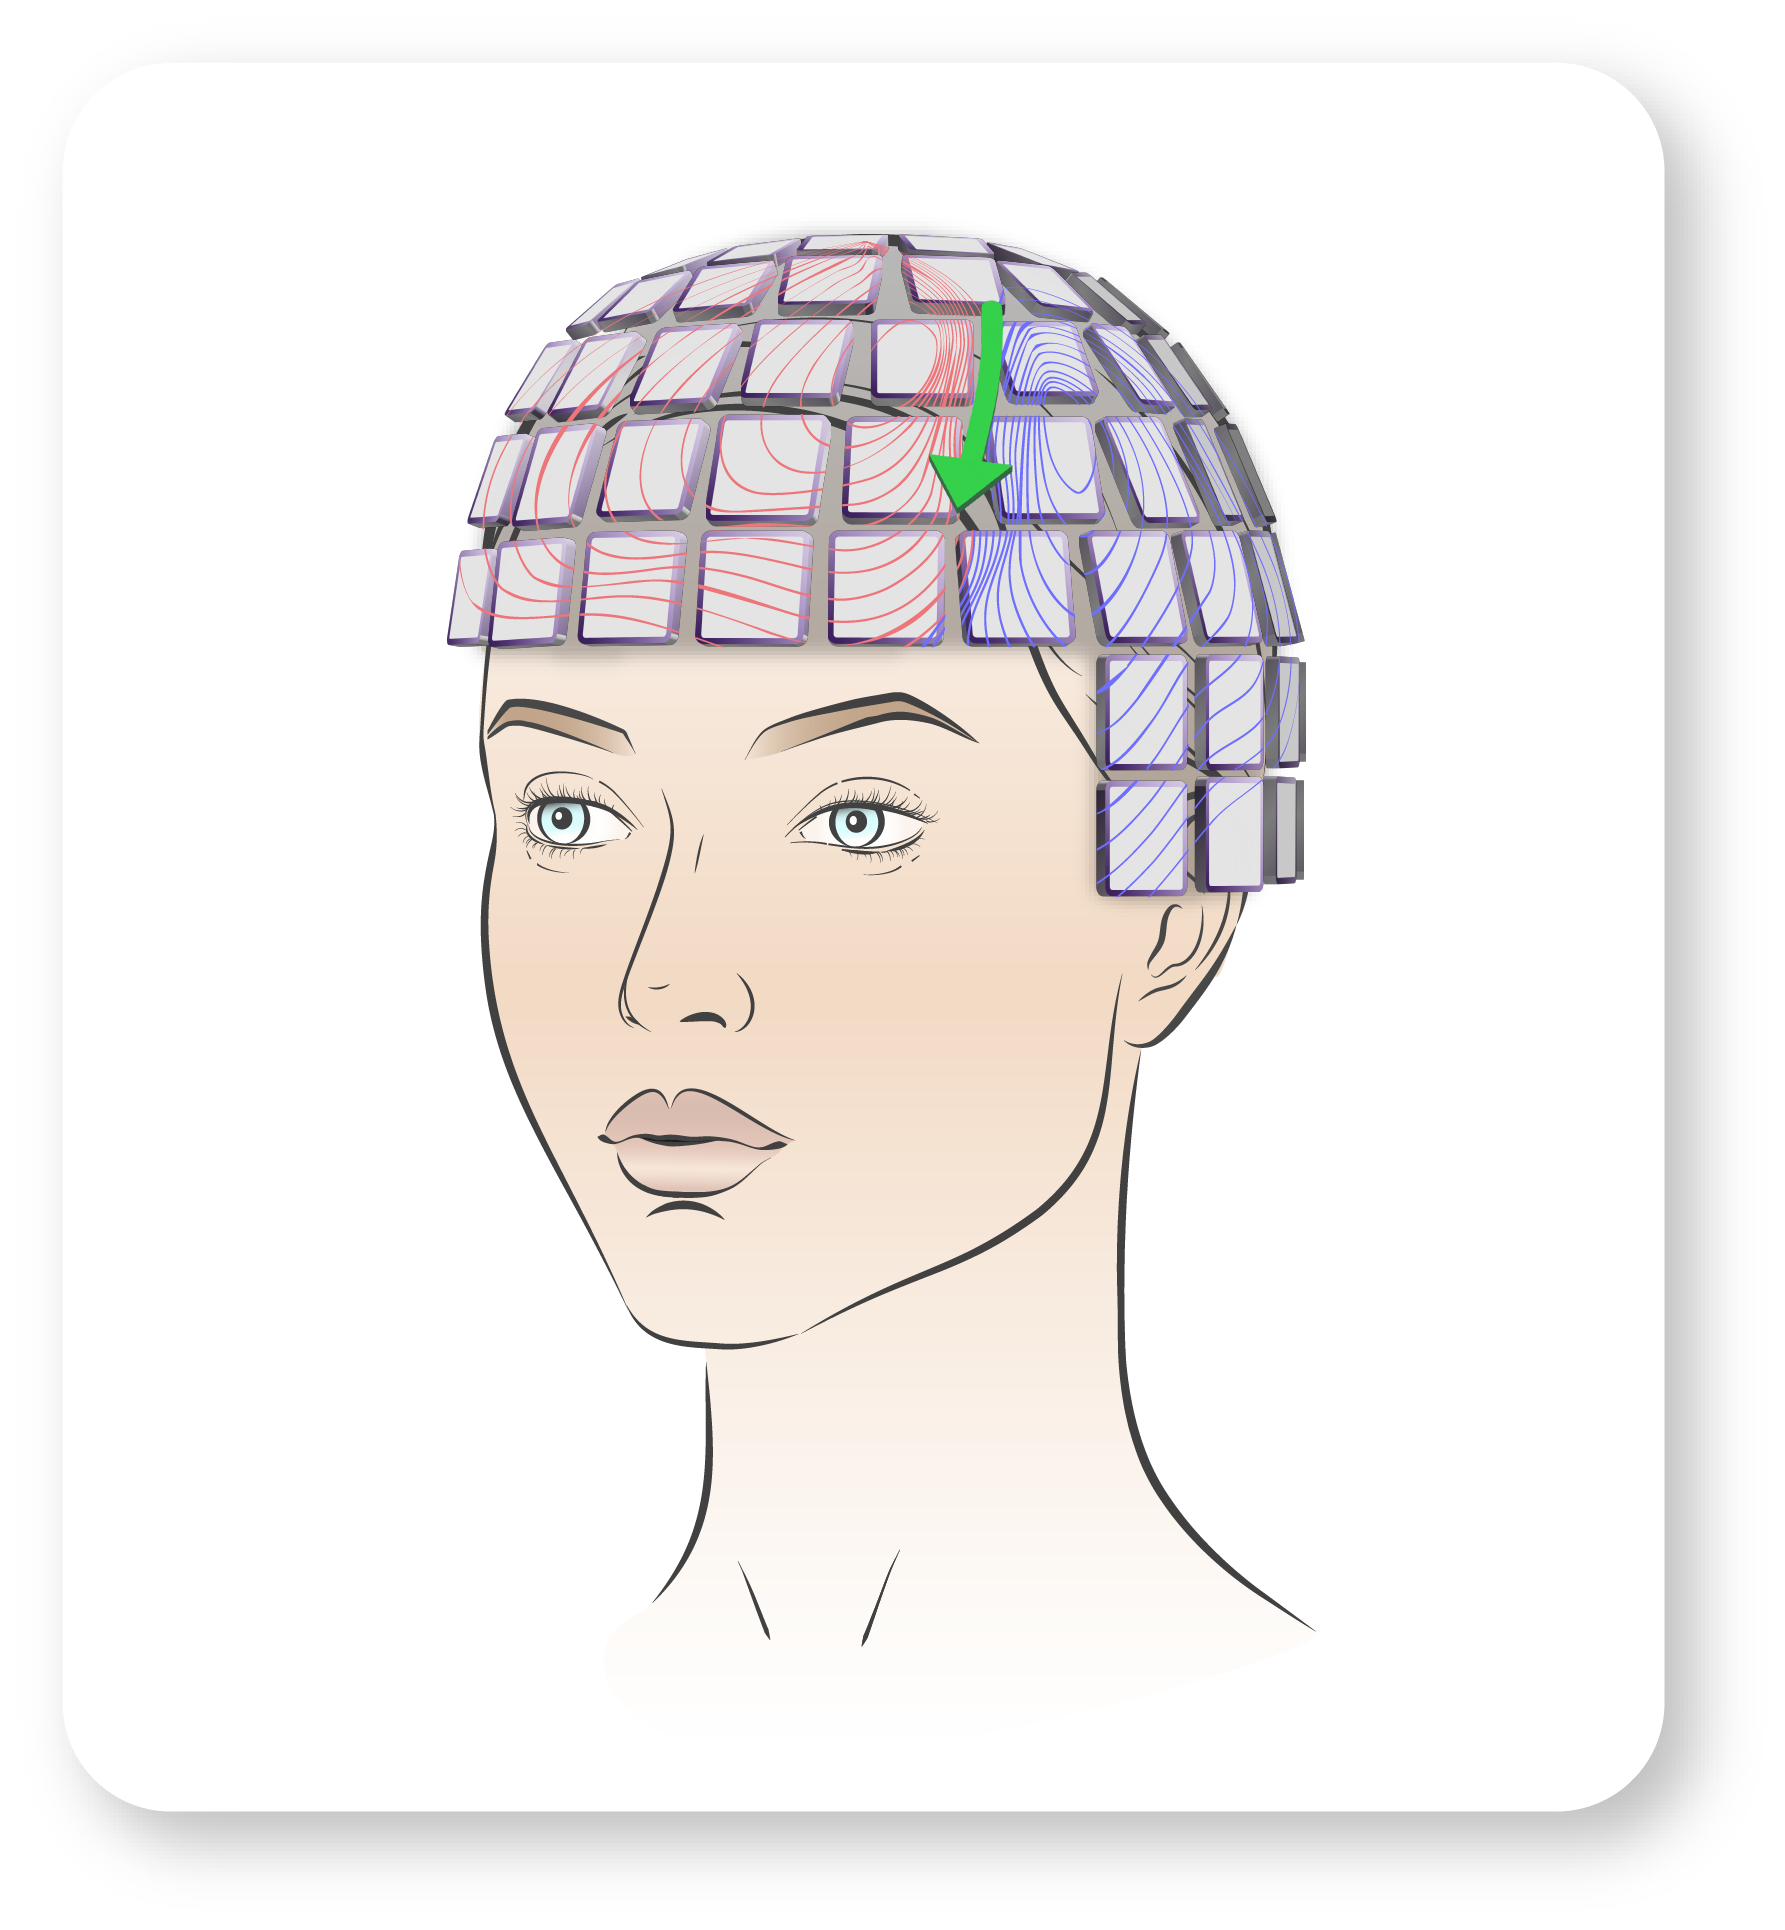
Image 11. An artist rendering of a simple right frontotemporal dipolar field overlaid on the sensors of a whole head system. The dipole is a common method for localizing the neural generator of a given neural signal. The method relies on the assumption that many neural signals can be reliably presented with a limited set of dipolar fields.
Time scales and typical temporal patterns
MEG data is recorded as continuous data for many minutes at a time. The timescale of interest varies with the variable we are trying to analyze. With primary responses – evoked fields – we typically look at a time scale of 500-1000 ms post stimulation. Multiple stimuli are recorded, in the range of 70-120 stimulations, and then the responses are averaged with respect to the trigger. By averaging we remove random noise and both oscillatory and random brain signals from the evoked responses.
For example, the common temporal characteristic of auditory stimulation is well known and consists of a plethora of distinct peaks and valleys with their typical latencies. For the auditory stimulation the M100 and the M200 are well known and represent cortical processing of auditory input.
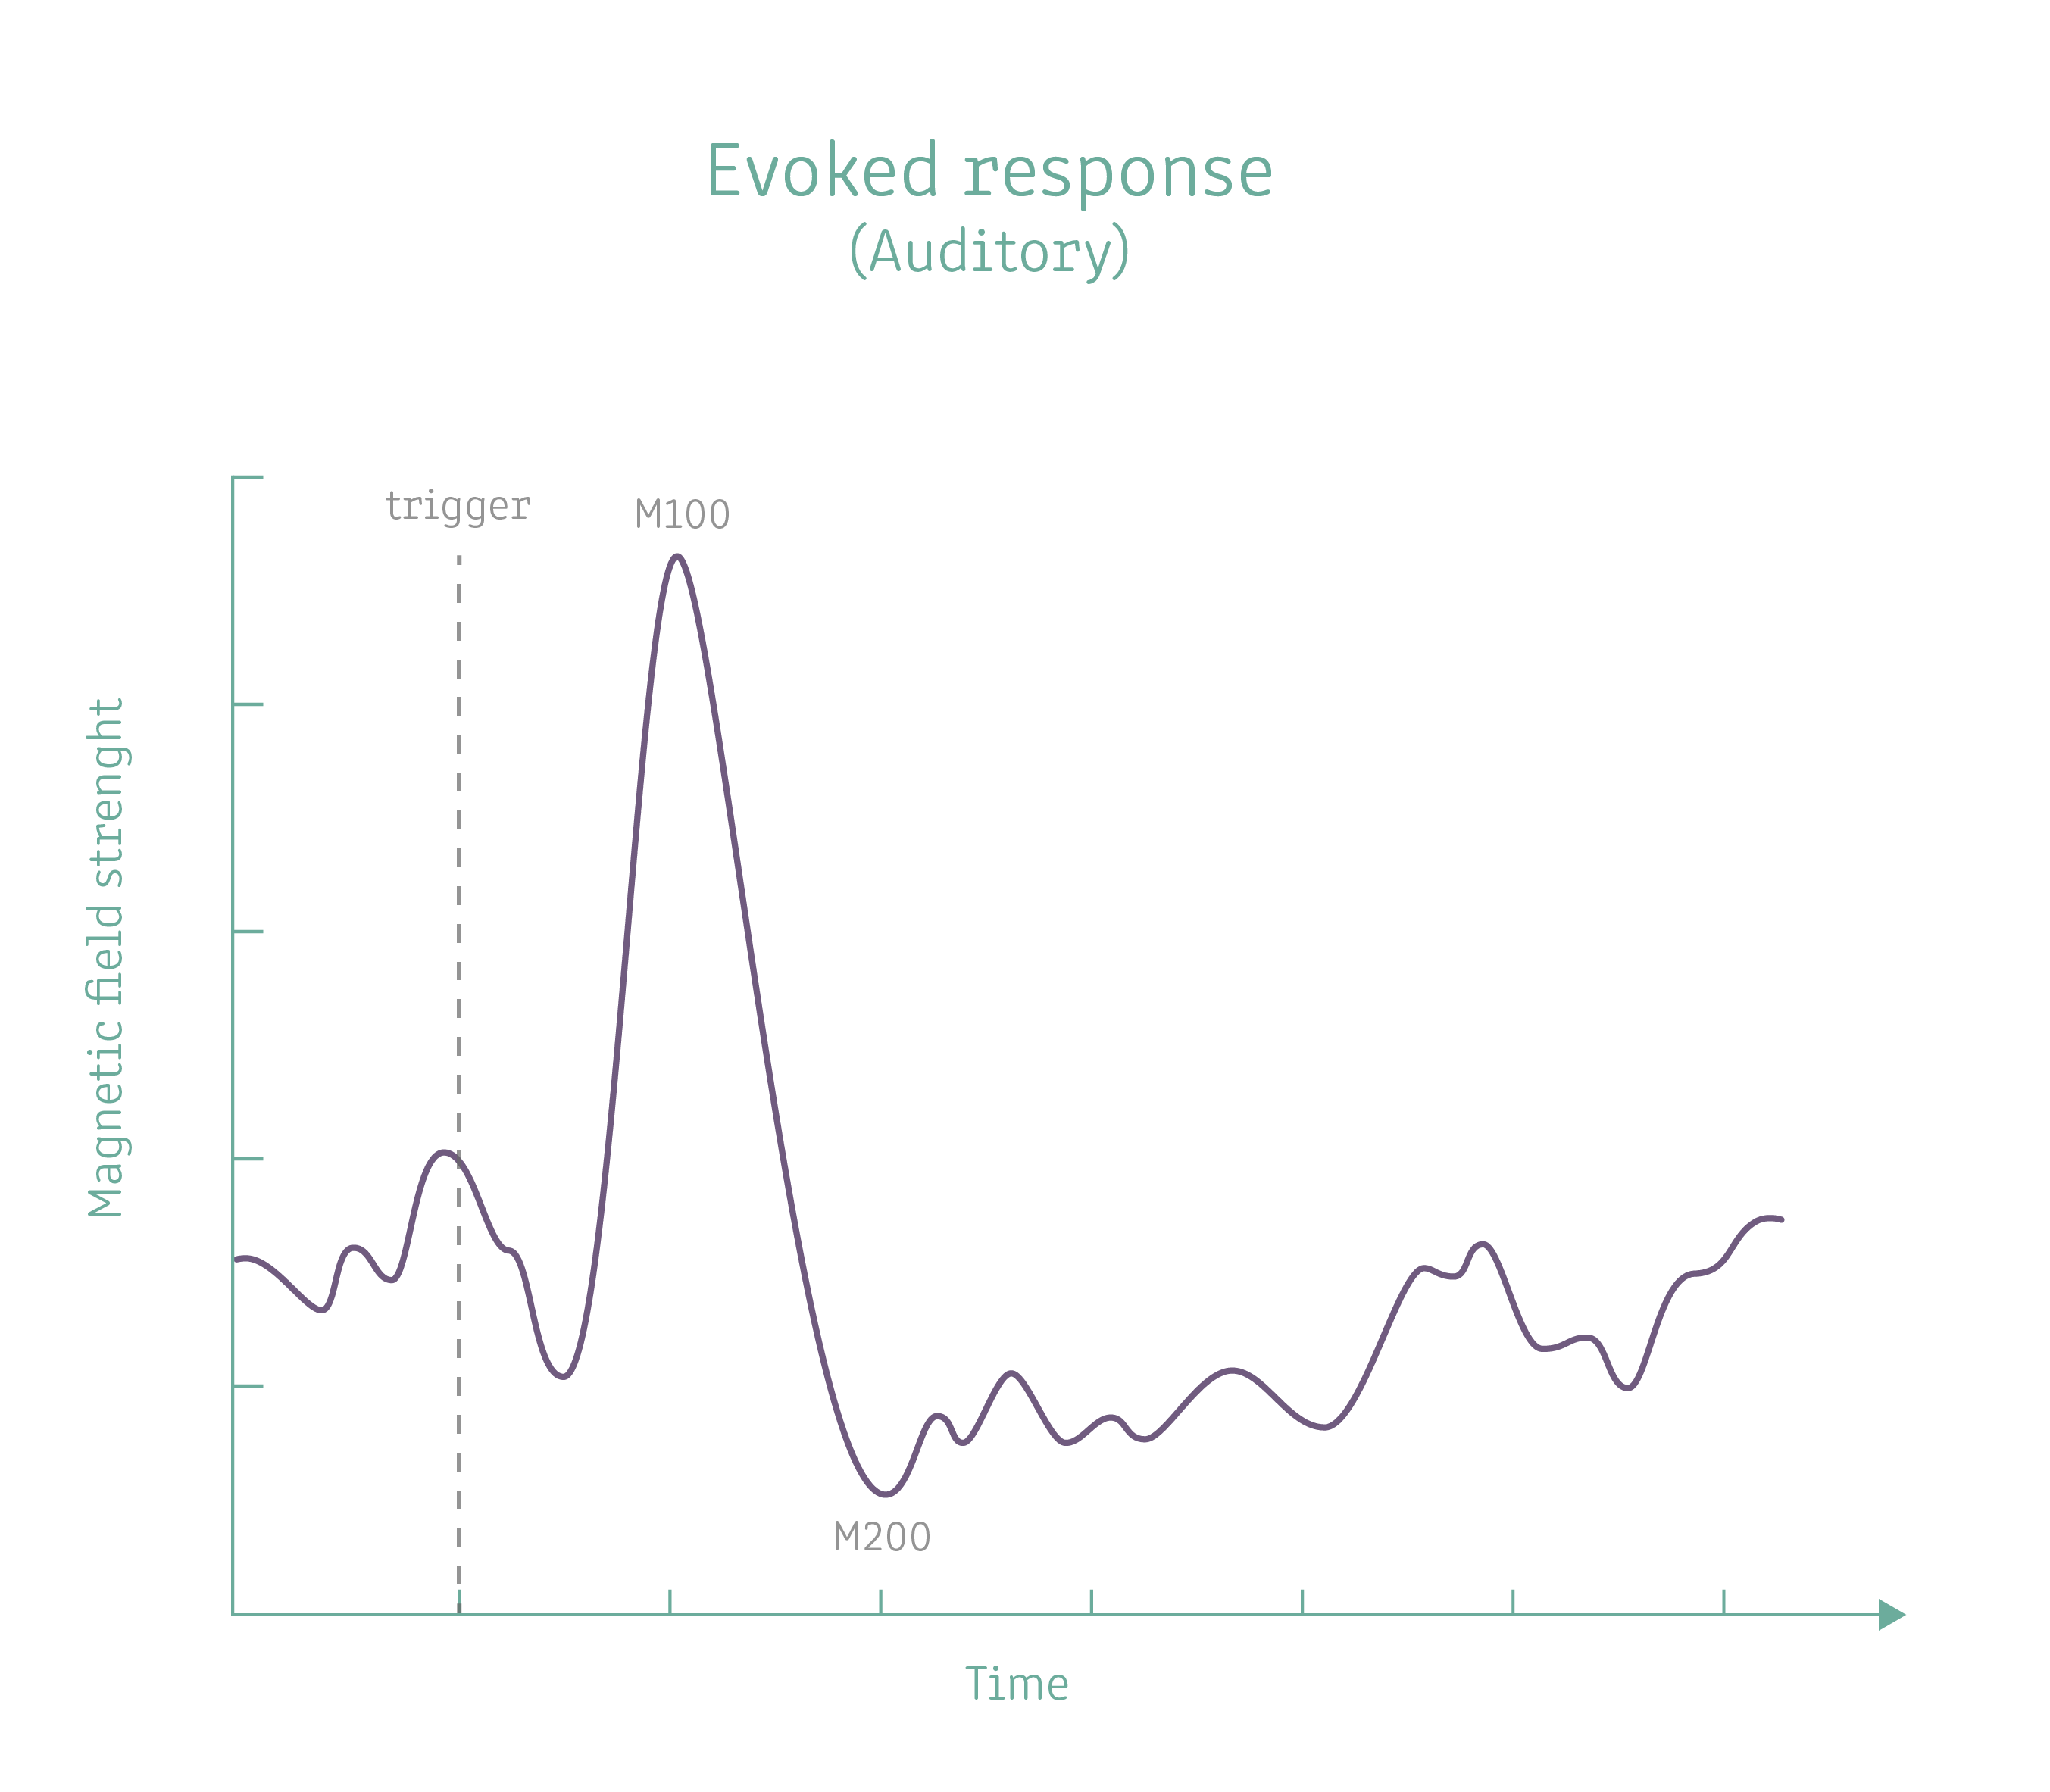
Image 12. Auditory evoked potential with the M100 and M200 visible.
When we are inspecting the MEG data in the frequency domain, we often look at longer timescales. Looking at the frequency domain means that we calculate the power of oscillatory amplitude for specified times and frequency bands. After that we can look at the oscillatory power and its changes in relation to a trigger. These responses are called induced responses as the stimulus induces a change in the oscillatory activity of the cortex. Typical examples of induced responses are both beta band oscillations that emerge when planning motor action and are suppressed during motor action. These are visible with MEG in the range of 100-200 ms after the onset of the activity.
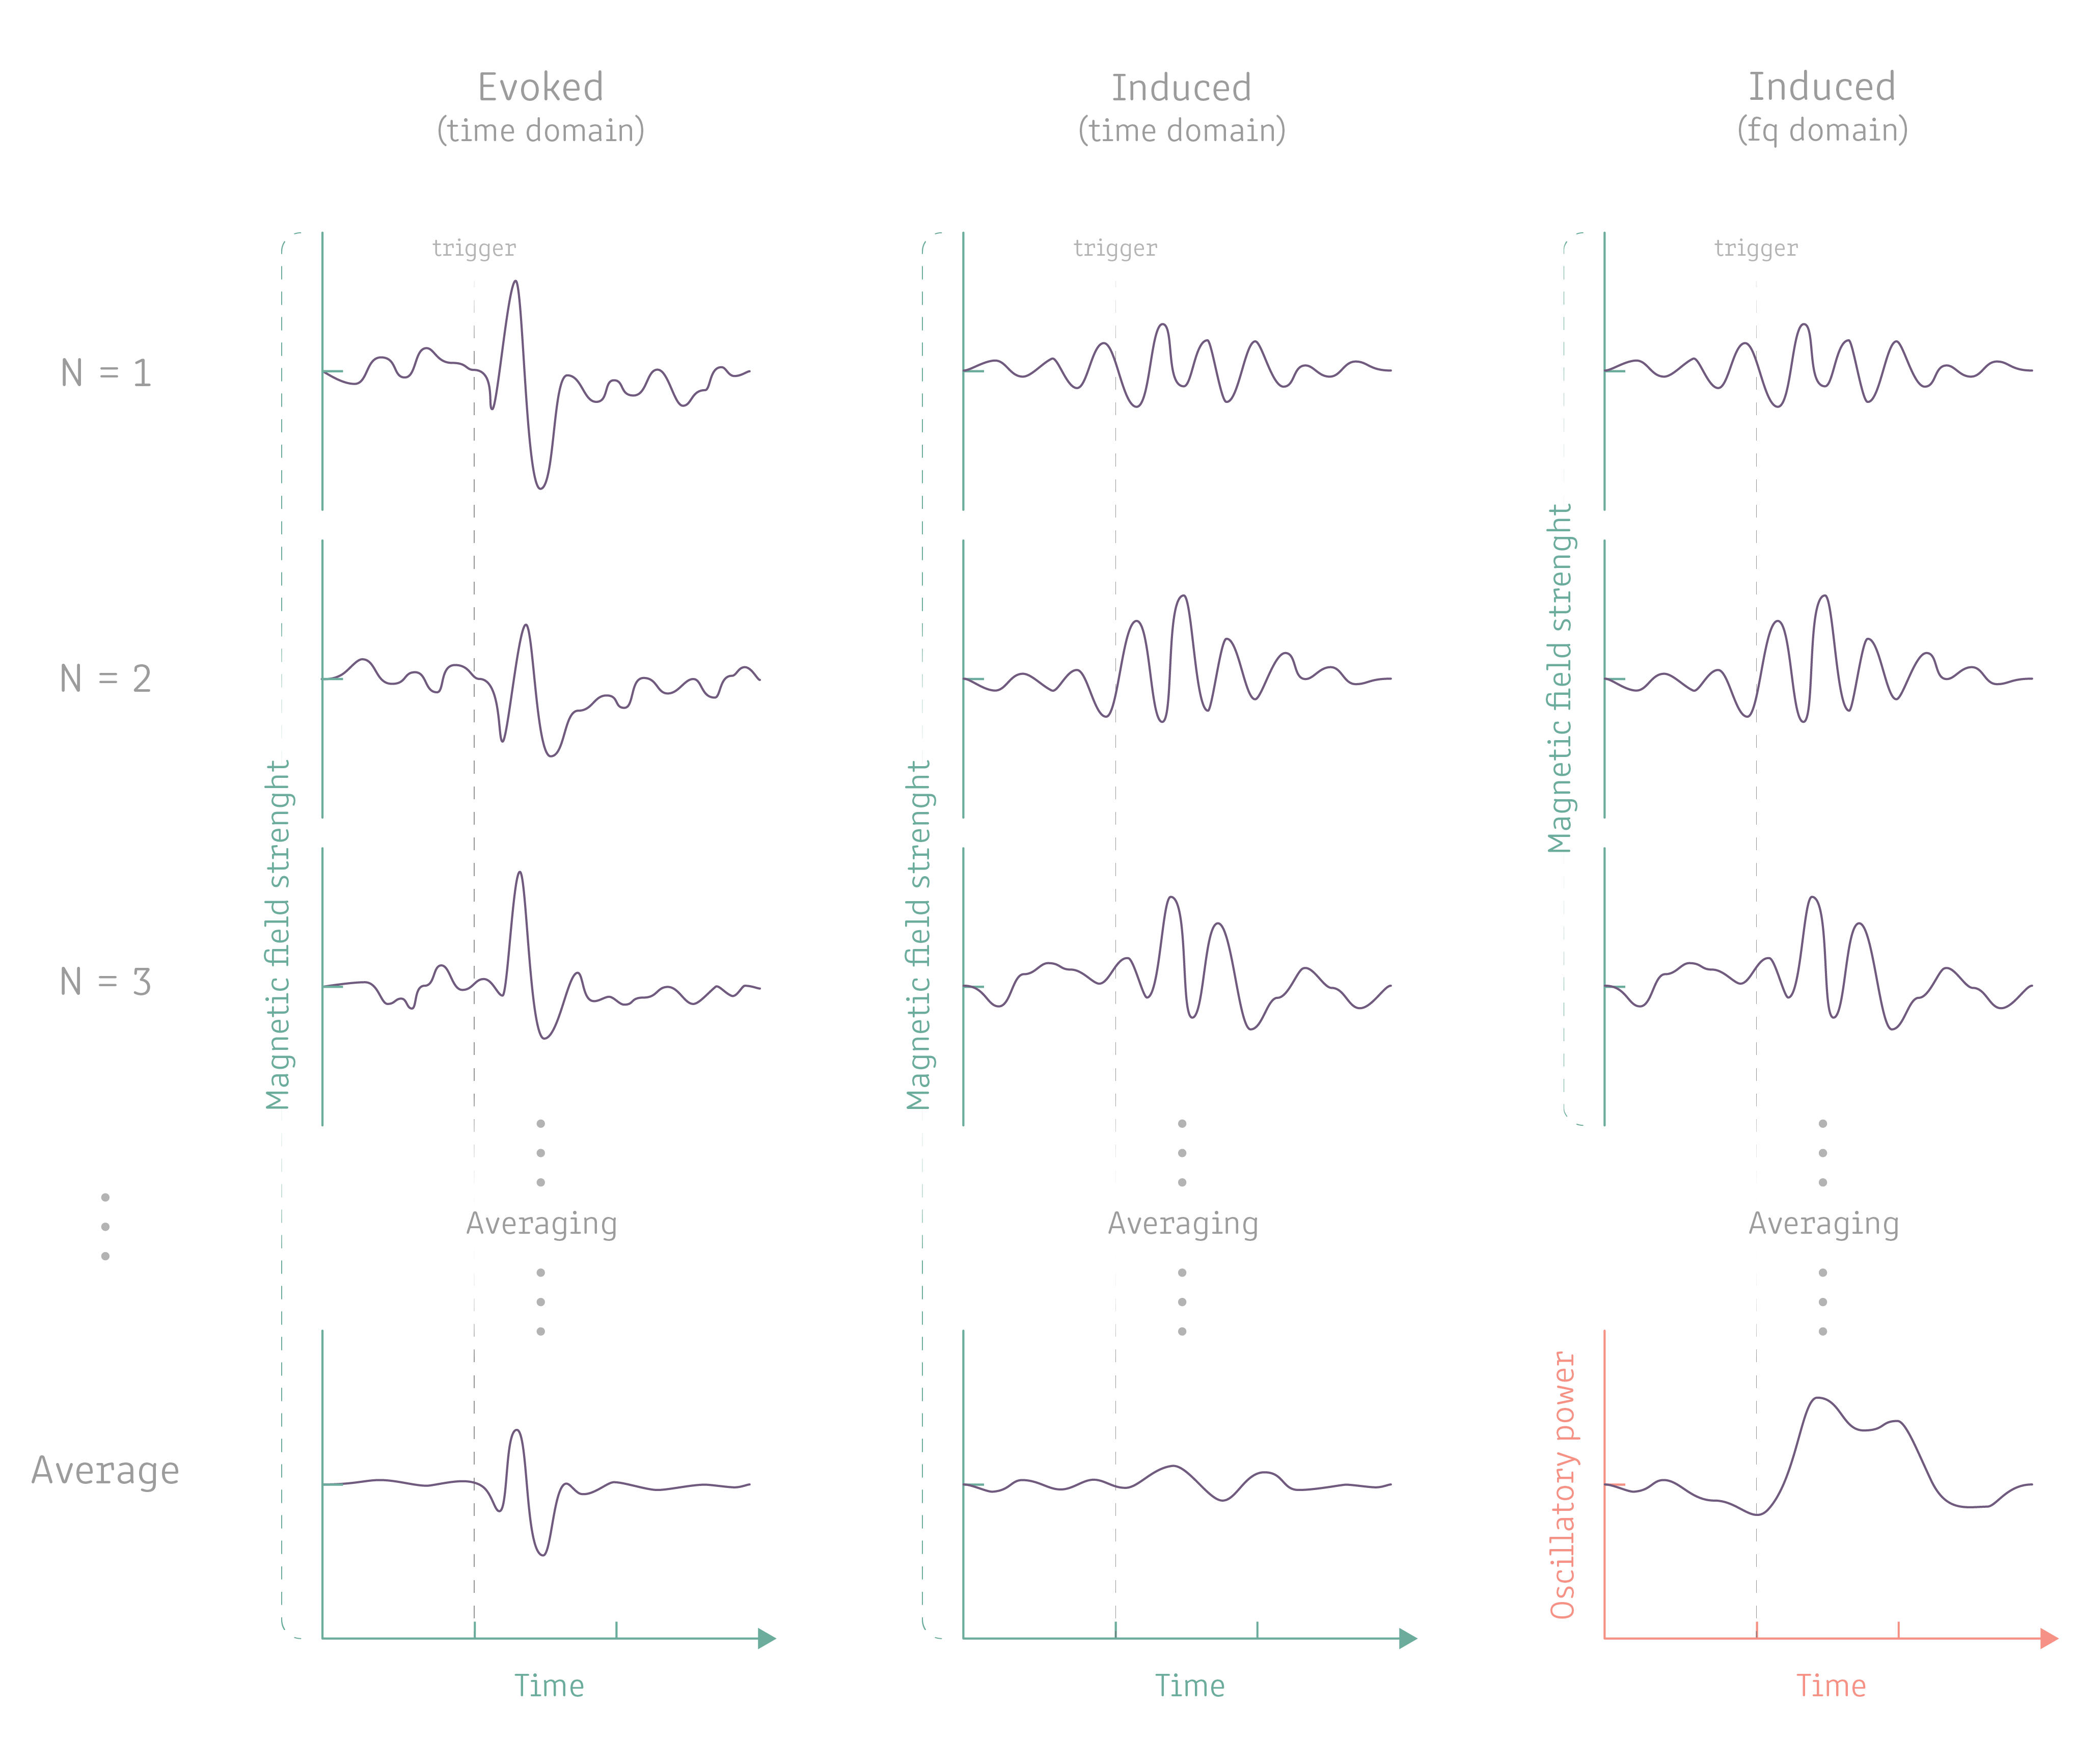
Image 13. The difference between evoked vs. induced responses. The evoked responses are phase locked responses in relation to a trigger and thus averaging multiple responses reduces noise and enhances the resolution of the response (left most column). An induced response is an increase in the oscillatory activity in some cortical area, but the oscillatory activity is not phase locked to the trigger. Thus, averaging the strenght of the magnetic field across trials would only cancel out any induced response (center column). On the other hand, by converting the data from time to frequency domain, we can then average the responses and get a nice representation of the changes in oscillatory activity as a function of time (right most column).
The averaging procedure mentioned above (also in Image 13) assumes that there is an average brain response, i.e. a signal with roughly the same time course in every epoch for a particular stimulus category. What if the signal is oscillatory, so that it consists of a sequence of positive and negative deflections? Then averaging the responses would most likely average the resonse to zero. These signals are called induced responses in order to distinguish them from the evoked fields that are both time- and phase-locked to the stimulus. In order to extract induced signals from the data, the frequency power spectrum (i.e. the signal amplitude for different frequency bands) has to be computed for every epoch separately. The power spectrum only contains information about the amplitude of the signal for a certain frequency in a certain latency range, but no phase information. If there is, e.g., a consistent increase in beta oscillations somewhere around 600-1200 ms after voluntary movement of the body, the spectral power in the beta range should be above baseline level in the latency range across epochs. Thus averaging the frequency domain epochs should lead to a nice representation of the induced response. This is true and is called the beta motor rebound.
Power spectra
Power spectra is the representation of the acquired MEG data by converting it into the (time-)frequency domain. With this we can easily look at the composition of oscillatory components of the data. Oscillatory signal components have a more compact representation in the spectral domain. There are different types of spectral analysis methods, but the choice of method is generally not as important as its correct application. There are two main categories of methods: parametric and non-parametric.
With the analysis of the power spectra, we can look at the total oscillatory activity in the data set. This is especially useful when looking at data quality. With the power spectra we can see, e.g., power line noise and other noise in the data. Appropriate noise reductions can then be employed to attenuate the noise.
The induced responses are a form of spectral power analysis. They are just centered around a trigger and analysed for each time point seperately, lending to a frequency-time representation.
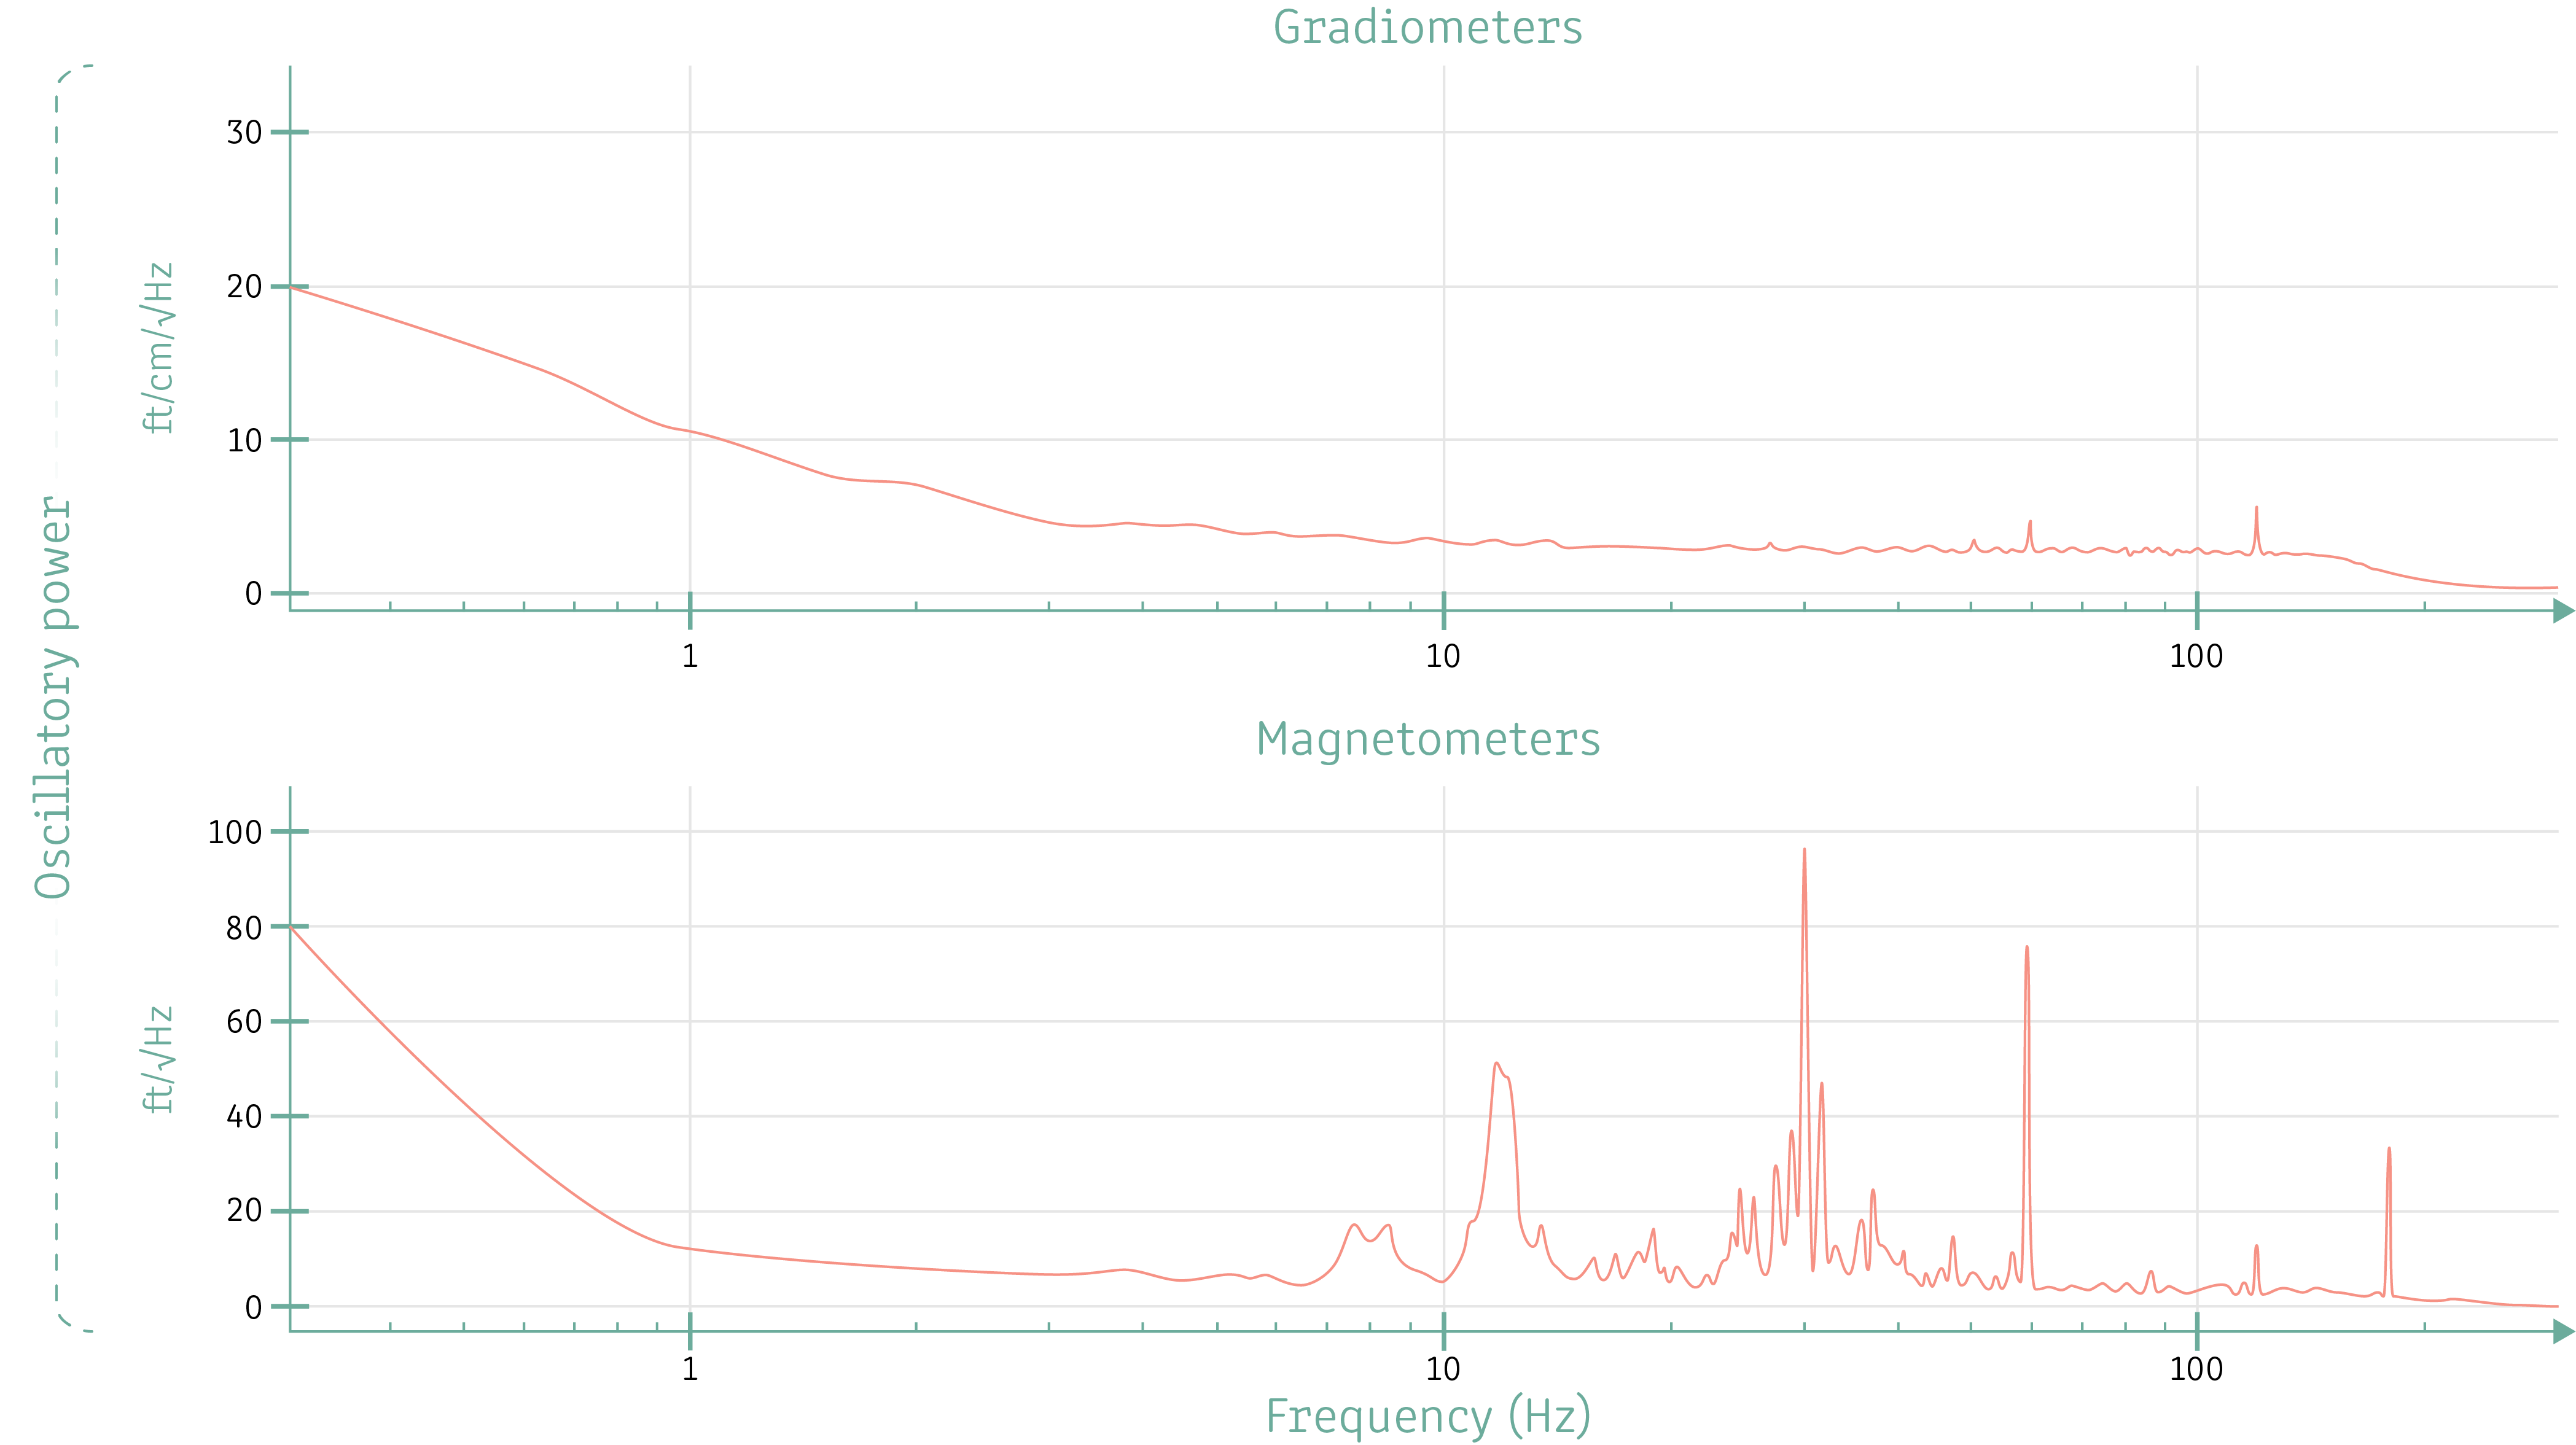
Image 14. Power spectra of an empty room measurement showing the oscillatory magnetic noise present in the magnetically shielded room. For example, ion the mag-channels, there is a clear narrow-band 30 Hz noise that has a harmonic at 60 Hz. Also, in the image we can see that the gradiometers are generally les noisy than the magnetometers.
Networks
With neuroimaging it is possible to look at the interplay of different brain regions both near and far from each other. The connectivity of the brain has been studied with MRIs and especially Diffusion Tensor Imaging. The problem with these is that they represent mainly the anatomical side of the problem. With MEG it is possible to look more closely at the temporal dynamics of of the connectivity to better understand the functional connectivity of the brain.
There are many different methods to use in the analysis of the connectivity of brain regions. Many of them rely on predefined regions of interest. The idea is to look at the oscillatory activity in the whole brain and try to determine if some regions are connected functionally to each other. This connection can be mediated by different forms of coupling between signals. Two well known couplings are are phase amplitude coupling and cross-frequency coupling. By analyzing these couplings for predefined regions, we can calculate the functional connectivity of the brain. Not to say the methods are without their limitations, but MEG is an up-and-coming resource in uncovering the functional networks of the brain.
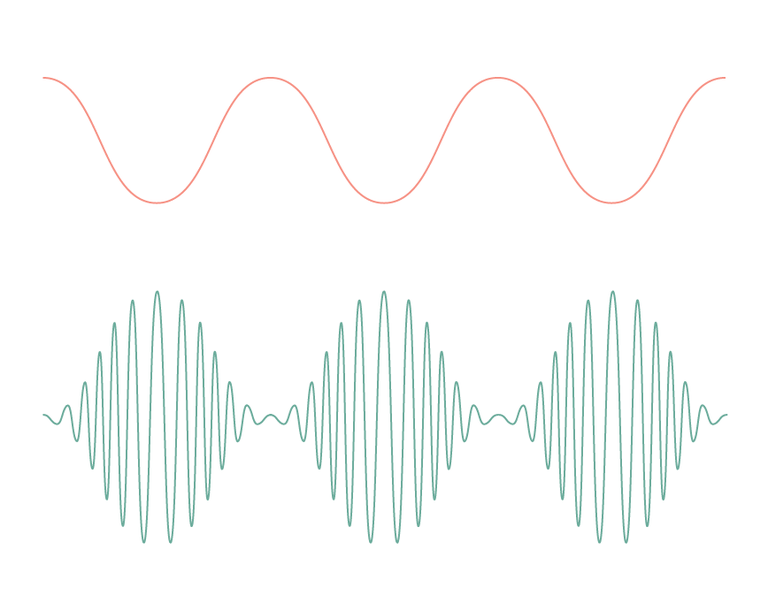
Image 15. Phase amplitude coupling (PAC). A common form of cortical networks interacting with each other. In this example the phase of the orange wave is modulating the amplitude of the green wave.